Over the years I have come to the realization that I am a visual learner. Actually, I think I am a mix of visual and kinesthetic. When learning something new, it really helps when I can see and do it. Is there anybody else out there that can relate?
So, I am sure that you have kids in your classroom that are the same. Using visuals when teaching can greatly help with increasing understanding. And I am sure that many of you use visualization strategies in reading, but I am here to tell you that you can use the same types of strategies during your math lessons. I hear you asking "How?" Let’s get to the math!
One way is to use graphic organizers. They are great for organizing content and ideas. There are many different types that you can use to help students internalize what they are learning.
It was a hard decision, but here are my TOP 5 graphic organizers that are great to use during math class.
Number 1: The T – Chart
T – Charts help students visually organize their thoughts and ideas. These versatile organizers can be used
Best Used For: Taking Notes, Comparing Ideas, Listing Details for Main Idea, Teaching Vocabulary
Example Math Topic: Multiplication and Division
Number 2: The Venn Diagram
Venn diagrams require high-level thinking because students must compare and contrast 2 or more ideas.
Best Used For: Comparing and contrasting ideas and concepts
Example Math Topic: Area and Perimeter
Number 3: The Web
Webs are great for linking together ideas and concepts. You can use them to brainstorm what students already know or to recap what was learned. You can record anything that comes to mind.
Best Used For: Brainstorming, Organizing Ideas and Concepts, Showing Examples, Making Connections
Example Math Topic: Quadrilaterals
Number 4: The Classification Diagram
Ideas and concepts are arranged by shared qualities are characteristics.
Best Used For: Organizing and Classifying Information
Example Math Topic: Decomposing, Showing Examples
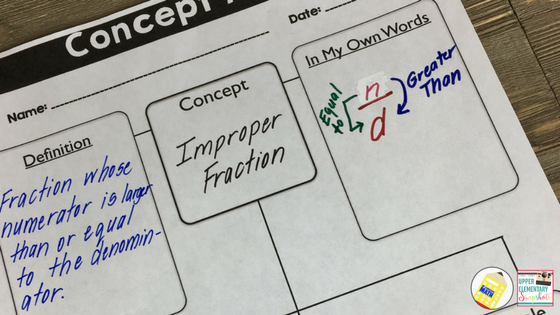
Number 5: The Concept Map
Concept maps show a connection or relationship between concepts. There are many variations of this graphic organizer. It all depends on the types of connections you want to highlight. This is usually more structured than a The Web.
Best Used For: Teaching Vocabulary, Linking Concepts and Ideas, Showing Examples and Non-Examples
Example Math Topic: Improper Fractions
Graphic organizers are so versatile that they can be used in any content area and for any grade level. They assist ALL students with remembering and connecting information because the can “see” it.
So let’s share the love and start using these visual frameworks during math because they are not just for the reading block.
Get started today by downloading these FREE graphic organizer templates that include the TOP 5 listed in this post.
How do you use graphic organizers during your math instruction? Please leave a comment below.
I hope you enjoyed reading this post. For more elementary math tips and strategies check me out at mrelementarymath.


